
Why do tech stocks feel like a rollercoaster? Discover the secrets behind Nasdaq 100’s extreme booms and busts to gain your investing edge. #Nasdaq100 #TechInvesting #MarketVolatility
Quick Video Breakdown: This Blog Article
This video clearly explains this blog article.
Even if you don’t have time to read the text, you can quickly grasp the key points through this video. Please check it out!
If you find this video helpful, please follow the YouTube channel “LifeNextDaily,” which delivers daily news.
https://www.youtube.com/@LifeNextDaily
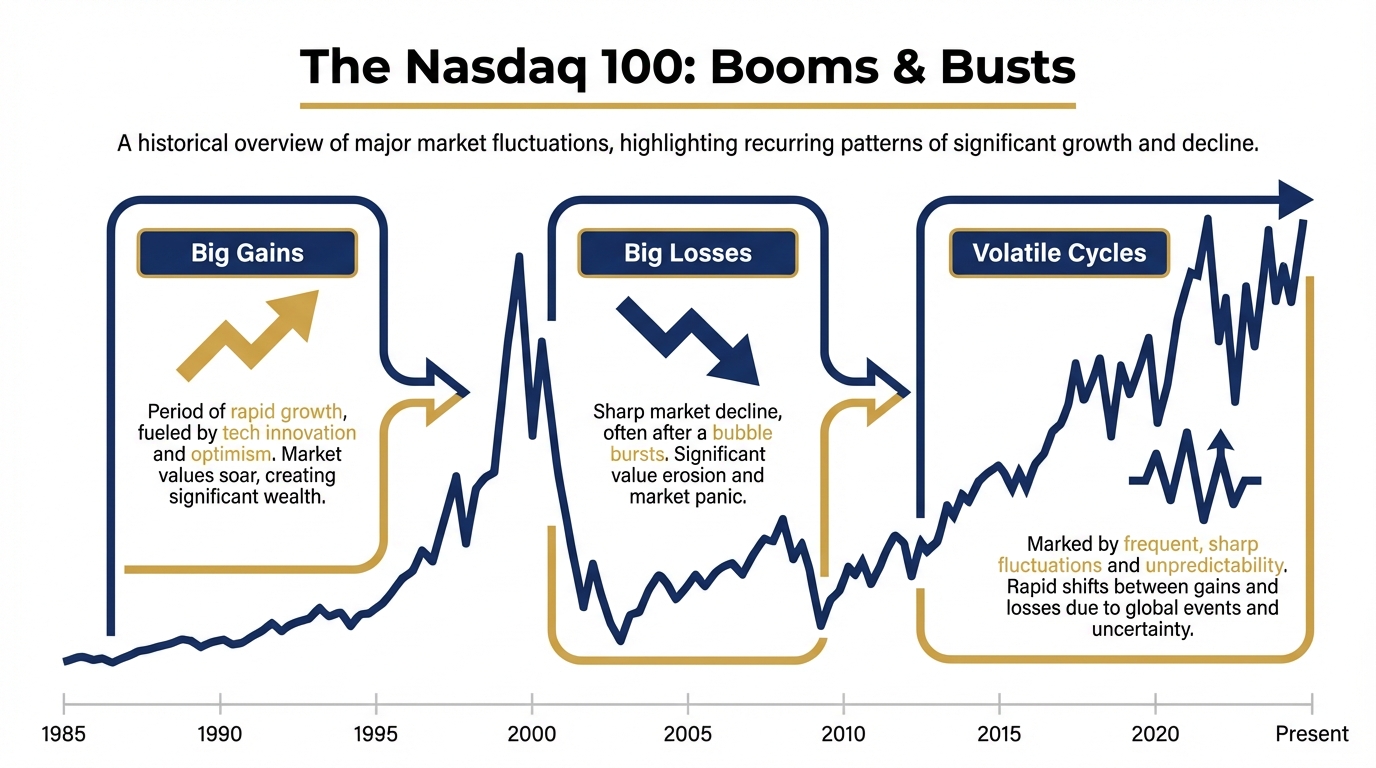
The Nasdaq 100: Booms & Busts
⚠️ WARNING: Investments involve high risk. This is not financial advice. DYOR (Do Your Own Research).
John: 👋 Hey, Future Millionaires! If you’ve ever dreamed of riding the tech wave to riches, only to wonder why it sometimes feels like surfing a tsunami, welcome to the wild world of the Nasdaq 100. We’re diving into its booms and busts—those heart-pounding highs and gut-wrenching lows that make investing in tech stocks feel like a blockbuster thriller.
Lila: Exactly, John. For beginners, think of the Nasdaq 100 as the cool kid’s table in the stock market cafeteria—packed with tech giants like Apple, Microsoft, and Nvidia. But why talk about this now in 2025? Well, with AI exploding (hello, capex surges from recent earnings), the index is on fire again. Recent data shows it’s outperformed the S&P 500 over the last 17 years, but not without massive drawdowns—like that -80% plunge after the dot-com bubble. As we close out 2025, with the Dow up 13% and tech still dominating, understanding these cycles could be your edge. Just remember, we’re here to educate, not advise—markets can flip faster than a bad date.
John: Spot on, Lila. Researching deep market trends can be exhausting—sifting through historical charts and earnings reports. Stop endless scrolling. Ask Genspark to summarize the facts for you. It’s like having a personal analyst on speed dial.
The Problem (The “Why”)
Lila: Okay, rookies, let’s get real: Why do booms and busts happen in the Nasdaq 100? It’s like a rollercoaster designed by mad scientists—thrilling ascents fueled by innovation, followed by stomach-dropping falls when hype meets reality. Imagine planting a garden: You water the tech seeds (AI, biotech), they bloom into massive gains, but a frost (like economic downturns) wipes out half the crop. That’s the bottleneck—tech-heavy indexes like the Nasdaq 100 amplify volatility because they’re bets on future disruption, not steady dividends. Historical data? The index dropped over 80% in the dot-com bust and again around the Great Financial Crisis, while the S&P 500 “only” fell 57%. Investors chase the booms but forget the busts can erase years of gains.
John: Haha, Lila, your garden analogy nails it—except these “plants” are trillion-dollar companies that can wither overnight. The economic bottleneck? Overvaluation during hype cycles, where FOMO (Fear Of Missing Out) drives prices sky-high, only for corrections to hit hard. One perspective is that this volatility rewards long-term risk-takers, but consider the risks: emotional stress and potential losses. Need to explain this concept to your team or family? Use Gamma to generate a visual presentation in seconds.
Under the Hood: How it Works
John: Alright, let’s pop the hood on the Nasdaq 100. This index tracks the 100 largest non-financial companies on the Nasdaq exchange—think tech behemoths, consumer discretionary plays, and health innovators. It’s not your grandpa’s blue-chip portfolio; it’s weighted toward growth, with heavy emphasis on sectors like Technology (over 50% as of Q3 2025). The mechanism? Market-cap weighting means giants like the “Magnificent Seven” dominate, amplifying booms when AI or cloud computing surges (recent earnings showed 81% of firms beating estimates by weight). But busts? When bubbles burst—dot-com in 2000, or the 2022 inflation scare—the index craters because these stocks are priced for perfection. Research suggests it’s outperformed the S&P 500 long-term (e.g., 17-year edge per Nasdaq data), but with higher volatility. Analogies help: It’s like a sports car—fast and exciting, but prone to crashes if you don’t handle curves well.
Lila: John, break it down simpler for intermediates. The core: Booms come from innovation cycles (AI capex rising sharply in 2025), busts from external shocks (recessions, rate hikes). Use tools like TradingView for charts—see those historical averages? Nasdaq 100’s yearly returns fluctuate wildly, with biggest ups over 100% and downs to -50%. No gatekeeping: Diversification via ETFs like QQQ mitigates some risk, but it’s not foolproof.
| Aspect | Old Way (Traditional Investing) | New Way (Nasdaq 100 Focus) |
|---|---|---|
| Composition | Diversified across all sectors, heavy on stable industrials | Tech-heavy, innovation-driven (e.g., AI, biotech) |
| Volatility | Lower, with max drawdowns around 50-60% | Higher, with 80%+ drops in busts |
| Long-Term Returns | Steady ~10% annual average | Higher potential (e.g., 12-15% over decades, per historical data) |
| Risk Management | Relies on dividends and bonds | Uses DCA and diversification across growth stocks |
Practical Use Cases & Application
Lila: So, how does this change your daily life or portfolio? For beginners, imagine reallocating part of your savings to a Nasdaq 100 ETF during a bust—buying low like snagging Black Friday deals. Intermediates might use it for growth allocation: Say, 20-30% of your portfolio in QQQ for tech exposure, balanced with stable assets. Real scenario: In 2025’s AI boom, holding through volatility could amplify returns, but a bust (like post-Nvidia earnings dips) tests patience. One perspective: It teaches resilience—markets recover, as history shows post-2000 and 2008 rebounds. Want to share this insight on TikTok/Shorts? Turn this article into a viral video using Revid.ai.
John: Lila, add some humor: Don’t be the investor who panic-sells at the bottom, like jumping off the rollercoaster mid-drop. Practical tip: Track seasonality—data shows Nasdaq strength around Thanksgiving, per recent volatility trends. In your portfolio, it means higher rewards for higher risks, but always diversify.
Educational Action Plan (How to Start)
John: Ready to level up? Here’s a step-by-step guide, no fluff.
Level 1 (Learn): Start by reading historical performance charts—check sites like Trade That Swing for Nasdaq 100 averages, including biggest booms (e.g., 100%+ years) and busts. Study Modern Portfolio Theory to understand risk-reward balance. Watch Huberman-style podcasts on behavioral finance to grasp why emotions drive busts.
Level 2 (Act): Test small—open a brokerage account and practice DCA into QQQ on a testnet or paper trading app. Set alerts for drawdowns over 20%, and rebalance annually. Remember, results vary; this is about building habits, not guarantees.
Lila: Too much text? Let Nolang explain this document to you in a video summary. It’s like having a tutor break down the booms without the boredom.
Conclusion & Future Outlook
Lila: Wrapping up: The Nasdaq 100’s booms offer massive rewards—think compounding at 12%+ annually over decades—but busts demand steel nerves, with risks of 80% losses. Effort vs. gain? Low if you automate and stay long-term, high if you chase hype. Looking to 2026, history suggests more tech surges (per Motley Fool insights), but volatility persists. Balance is key—rewards for the patient, wipeouts for the reckless.
John: Smart people automate. Whether it’s health logs or price alerts, set up workflows with Make.com to save time. Remember, DYOR—markets aren’t a game, but understanding them levels the playing field.

👨💻 Author: SnowJon (Tech & Life Researcher)
A researcher leveraging insights from the University of Tokyo Innovation Programs to share practical wisdom on Health, Wealth, and Self-Growth. While working as a professional, he operates 8 blog media outlets & 9 YouTube channels.
His motto is to translate complex theories (whether blockchain or biology) into tools anyone can use.
*This article utilizes AI for drafting, but all verification is performed by the human author.
🛑 General Disclaimer
This article is for educational purposes only. I am not a doctor or financial advisor. Information regarding health, investments, or law should be verified with professionals. DYOR and take responsibility for your own decisions.
🛠️ Tools Mentioned:
References & Further Reading
- The Nasdaq 100: Booms & Busts – A Wealth of Common Sense
- Historical Average Returns for Nasdaq 100 Index (QQQ) – Trade That Swing
- When Performance Matters: Nasdaq-100® vs. S&P 500 Q3 2025 | Nasdaq
- History Says the Nasdaq Will Soar in 2026: The Best Stocks to Buy With $250 Before It Does | The Motley Fool
- Here’s the Average Stock Market Return in the Last 10 Years, and What Wall Street Expects in the Future | Nasdaq