
Read this article in your native language (10+ supported) 👉
[Read in your language]
“`html
Housing Price Inflation: The Great Reset Is Here
⚠️ WARNING: This article discusses housing market trends and economics. It is not financial or investment advice. Always conduct your own research and consult qualified professionals before making housing decisions.
👋 Hey, Future Homeowners and Market Watchers!
John: Alright Lila, let’s talk about something that’s been keeping millions of people awake at night: housing prices. By now, everyone knows homes cost a fortune. But here’s the plot twist—2026 might be the year things actually start shifting. Not a crash. Not overnight relief. But a genuine reset after a decade of chaos.
Lila: Wait, “reset”? That sounds optimistic. Are you saying homes are suddenly going to become affordable?
John: Not overnight, but yes—there’s real momentum building. Home prices are expected to grow just 1–2.2% in 2026, while wages are projected to climb 3.6% or higher. For the first time since the Great Recession, your paycheck is growing faster than the sticker price. That’s the reset.
But before we celebrate, let me be clear: this isn’t a quick fix. It’s a multi-year trend toward normalization. And regional variation is *massive*—some places are already buyer-friendly, others still brutal.
Which one are you?
- The Skeptic: “I’ve heard this before. Prices always go up. Why should I believe 2026 is different?”
- The Overwhelmed First-Timer: “I don’t understand mortgages, inflation, or why my parents’ $150k home is now $500k.”
- The Curious Builder:: “Okay, I see the data. But what does this mean for my specific market and timeline?”
- The Renter Watching from the Sidelines: “Everyone talks about buying. What about renters? Is 2026 my move?”
The Problem: Why We Got Here (And Why It Matters Now)
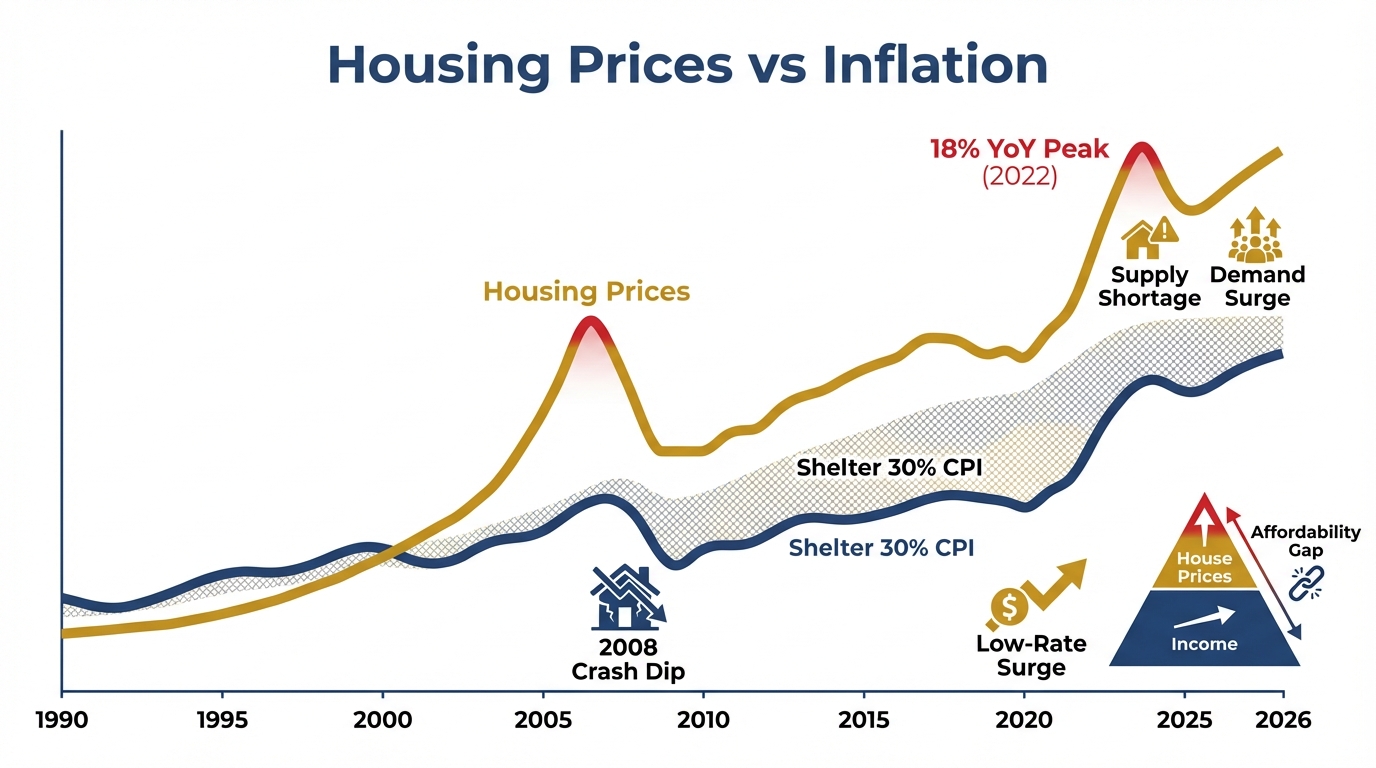
John: Think of the housing market like a traffic jam. For a decade, prices shot upward like a car in the fast lane—doubling, tripling, leaving wages in the dust. Why? A perfect storm:
- Pandemic migration: Remote workers flooded the South and West, driving up demand.
- Historic low rates (2020–2021): Borrowing cost nearly nothing. Everyone rushed in.
- Supply shortage: Not enough homes built. Inventory evaporated.
- Investor cash: Hedge funds and landlords scooped up properties, reducing stock further.
- Inflation + rate hikes: The Fed crushed mortgage rates up to 7%+ to fight inflation. Monthly payments exploded.
The result? A 27% jump in median home prices since 2019. A typical mortgage payment that consumed 35%+ of household income. And millions of young people, first-time buyers, and lower-income families locked out entirely.
Lila: So what broke the gridlock?
John: Three things. First, rates *finally* stopped climbing. Second, builders caught up and added supply. Third—and this is key—incomes actually started outpacing price growth. The market is self-correcting.
🚨 Myth vs. Reality:
Myth: “Housing prices always go up. Buy now or be priced out forever.”
Reality: Prices grow at different rates in different eras. Sometimes real (inflation-adjusted) prices *decline* for years while nominal prices climb—exactly what’s happening now. In 2026, real home prices are expected to fall slightly even as the sticker price rises 2.2%. That means your dollar goes further.
Takeaway: The urgency is lower than marketed. You have time to build a down payment and make a deliberate choice.
Under the Hood: How It Works
John: Let me break down the mechanics of this reset. It’s really about three moving pieces working in concert:
1. Mortgage Rates Stabilize (Not Crater)
Rates averaged 6.6% in 2025. Now they’re settling around 6.3% for 2026—still high by pandemic standards, but lower than 7%+. Why? The Fed’s done hiking. Inflation is cooling. Markets expect rate stability. A borrower locking in 6.3% today is paying meaningfully less monthly than someone who locked in 7% last year.
2. Home Prices Decelerate (Not Crash)
Price growth is slowing to 1–2.2% annually. That’s slower than wage growth (3.6%+). So even if the sticker price goes up, your paycheck climbs faster. Real purchasing power returns.
3. Inventory Recovers (Slowly)
Active listings are rising 8.9% year-over-year. Supply still lags pre-2020 norms by ~12%, but the trend is clear: more homes are hitting the market. More supply = less bidding wars = buyer leverage.
The Cascading Effect:
Lower rates + slower price growth + more inventory = Monthly mortgage payments actually declining for the first time since 2020. The typical payment-to-income ratio drops below 30% for the first time since 2022. Affordability improves.
One Diagram, Three Layers
⏱️ 10-Second Version:
Prices growing slower than wages → You can afford homes again.
⏱️ 60-Second Version:
Mortgage rates stopped climbing and stabilized around 6.3%. Home prices are decelerating to 1–2% growth. Wages are rising 3.6%+. More inventory is hitting the market, reducing bidding wars. Result: Monthly payments fall, affordability improves, buyer bargaining power increases.
⏱️ 3-Minute Version:
The reset works *because* of specific economic conditions: Fed rate stability (not guaranteed to persist), wage growth outpacing inflation (assumes labor market holds), and builders successfully increasing inventory (supply chain disruptions or tariffs could reverse this). It’s not a permanent fix—regional variation is huge (Northeast/Midwest prices rising faster; South/West cooling). And it only “improves” affordability to ~29% of income, still above the historical 25% comfort zone. Young, lower-income, and first-time buyers benefit most. Investors may face headwinds in overbuilt markets.
Old Way vs. New Way
| Factor | 2020–2025 (The Squeeze) | 2026+ (The Reset) |
|---|---|---|
| Mortgage Rate Trend | Climbing fast (2% → 7%) | Stable or declining (~6.3%) |
| Price Growth Rate | 4–6.5% annually (fast) | 1–2.2% annually (slow) |
| Wage Growth | Lagging prices (2–3%) | Outpacing prices (3.6%+) |
| Inventory Status | Critically low (bidding wars) | Rebuilding (+8.9% YoY) |
| Payment-to-Income Ratio | 35%+ (unaffordable) | ~29% (approaching normal) |
| Buyer Power | Minimal (seller’s market) | Growing (balanced market) |
Practical Use Cases & Application
John: Let me give you four real scenarios where this reset changes the game:
Scenario 1: The First-Time Buyer
Sarah is 28, earns $75k, and has saved $40k for a down payment. In 2024, monthly payments on a $300k home ate 40% of her income—impossible. In 2026, with rates at 6.3% and prices growing just 2%, the same home might be $306k, and her monthly payment drops 1.3%. Suddenly, she qualifies for a loan. The reset gives her a window.
Scenario 2: The Renter Evaluating Markets
Marcus is renting in Austin, TX. Rents have been falling for two years (+0.2% to +1.6% growth expected in 2026, well below inflation). Vacancy rates are normalizing. For the first time, renting looks cost-effective versus buying. He can afford to stay put, build more savings, and buy from a position of strength in 2027–2028.
Scenario 3: The Existing Homeowner With an Old Mortgage
Jessica locked in a 7.2% mortgage in 2023. Refinancing volume is expected to jump 30%+ in 2026 as rates soften. She could shave $200/month off her payment by refinancing at 6.3%. That’s $2,400/year in breathing room—real money for a working family.
Scenario 4: The Investor Reassessing
An investor in Miami or Tampa faces falling prices (oversupply from the pandemic boom) and rising insurance costs. In 2026, she might cut losses or pivot to less volatile markets like the Northeast, where limited inventory is still driving prices up 3–4%. The reset isn’t uniform—it rewards smart regional positioning.
Reader Q&A
Lila: Okay, but you keep saying “modest.” Is 2.2% price growth and 6.3% mortgage rates actually good news, or is it just… less bad?
John: Fair pushback. It’s *less bad in the right direction*. You’re right that 6.3% is high compared to the 2–3% rates of 2020–2021. But here’s the shift: for the first time in a decade, your paycheck is climbing faster than home prices. That’s huge. It means each year you wait and save, homes become more affordable in real terms. The urgency to overpay vanishes. That’s the psychological and financial reset.
Lila: What if I’m in a hot market like New York or Boston? I heard Northeast prices are rising 3–4%, not 2.2%. Does the reset apply to me?
John: Great question. Regional variation is the biggest asterisk. In the Northeast and Midwest, limited inventory + strong labor markets = prices rising 3–4%. But even there, wages are rising 3.6%+, so you’re still gaining purchasing power. The reset is slower in supply-constrained regions, but the direction is the same. Meanwhile, in Southern and Western markets with excess inventory (Florida, parts of Texas), prices are actually softening. So yes, it applies—but how fast depends on your local market.
Educational Action Plan: How to Start
John: Here’s how to position yourself in 2026, whether you’re buying, renting, or building equity:
Level 1 (Learn):
- Understand your local market: Check inventory levels, price trends, and rent-to-buy ratios in your city. Markets are diverging fast.
- Learn mortgage basics: What’s a 30-year fixed rate? ARM? Rate buydown? You don’t need to become an expert, but basic literacy helps you spot opportunity.
- Follow affordability metrics: Track the payment-to-income ratio for your market. When it drops below 30%, you’re in healthier territory.
- Read neutral sources: Realtor.com, Zillow, and Redfin publish quarterly forecasts. Bookmark them and revisit quarterly.
Level 2 (Try Safely):
- If you’re renting: Don’t panic-buy. Use 2026 to build a larger down payment (12–20%). Rent prices are softening; lock in a lower lease.
- If you’re a homeowner: Check if you can refinance. A simple refinance calculator shows your payback period in months.
- If you’re saving to buy: Focus on income growth, not market timing. A $5k raise helps more than waiting for prices to drop 5%.
- If you’re an investor: Scout markets with pent-up demand (Northeast, Midwest) and avoid over-supplied regions (coastal Florida, parts of Texas).
Tiny Experiment: Your 15-Minute Market Pulse Check
Goal: Get a baseline understanding of your local housing market’s health.
Steps:
- Pick a neighborhood you care about (where you live or want to live).
- Visit Zillow or Realtor.com. Search for homes in your price range. Note how many listings are active.
- Click on a few homes and look at the “Days on Zillow” stat—how long have they been listed?
- Do the same search for rentals. Compare monthly rent to a hypothetical mortgage payment (use an online calculator).
- Write down: (a) # of listings, (b) average days on market, (c) rent vs. buy monthly cost.
What to observe: If listings are growing, days-on-market are climbing, and rent is cheaper than a mortgage + taxes + insurance, you’re in a buyer-friendly market. If listings are scarce, homes sell in days, and rent is expensive, you’re still in a seller’s market. No judgment—just data. Revisit in 3 months and watch the trend.
Conclusion & Future Outlook
John: Here’s the honest take: The Great Housing Reset of 2026 is real, but it’s not a rescue mission—it’s a recalibration. Homes are still expensive. Mortgages are still 6%+. But for the first time in a decade, the math is working *in favor* of buyers and savers, not against them. Wages are climbing faster than prices. Inventory is rising. Rates are stable. That’s a fundamental shift.
The tradeoff? You’re trading *urgency* for *deliberation*. You don’t have to overpay today. You can wait, save, and buy from strength. That’s powerful.
Lila: But what if the Fed changes course? Or inflation spikes again? Or there’s a recession?
John: Exactly. These forecasts assume stability. Tariffs, Fed policy shifts, a labor market hiccup—any of those could derail the reset. That’s why I keep saying it’s a trend, not a promise. But even in downside scenarios, the fundamental math—wage growth outpacing price growth—holds as long as unemployment stays below 5%. And that’s the baseline assumption.
Risk Ledger
What can go wrong?
- Tariff inflation: If tariffs push construction material costs up, builders could slow, inventory stalls, and prices re-accelerate.
- Labor market weakness: If unemployment climbs past 5%, wage growth could stall and the reset stalls with it.
- Regional divergence worsens: Hot markets (Northeast/Midwest) could see 4–5% price growth while supply-flooded markets (Florida) face sharp corrections—making “the forecast” useless for individual decisions.
- Fed policy reversal: If inflation re-ignites, the Fed could hike again, pushing mortgage rates back to 7%+ and killing affordability gains.
Who should be careful?
- First-time buyers in hot markets (Northeast, Midwest) still face steep prices despite slow growth.
- Lower-income renters: Even at 29% of income, a $300k home requires significant savings and income verification.
- Investors betting on rapid appreciation: In 2026, prices are growing 1–2%, not 4–6%. Returns are modest.
What is the safest minimum approach?
- If you’re renting and unsure: Stay put, lock in low rent, and save aggressively. The 2026 market is less punishing than 2023–2025.
- If you’re a homeowner: Refinance only if your current rate is 6.5%+ and you plan to stay 5+ years.
- If you’re saving to buy: Focus on income, not market timing. A $10k raise beats waiting for a 5% price dip.
What to Watch Next
- Indicator to monitor: The monthly payment-to-income ratio. If it climbs above 31%, the reset is losing momentum. If it drops below 28%, affordability is accelerating.
- Open controversy: Is the U.S. housing shortage 1.2 million homes (J.P. Morgan) or 5+ million (other estimates)? If shortage estimates are wrong, builders might overshoot, leading to price crashes in 2027–2028.
- Skill to build: Learn to read housing market reports quarterly. They’re free, they’re data-rich, and they beat 90% of market hot takes you’ll hear.
References
- Housing Price Inflation
- Realtor.com 2026 National Housing Forecast
- Zillow Home Value and Sales Forecast (January 2026)
- Redfin’s 2026 Predictions: The Great Housing Reset
- J.P. Morgan U.S. Housing Market Outlook 2026
- Marketplace: 2026 Housing Market Expectations and Predictions
“`
▼ AI tools to streamline research and content production (free tiers may be available)
Free AI search & fact-checking
👉 Genspark
Recommended use: Quickly verify key claims and track down primary sources before publishing
Ultra-fast slides & pitch decks (free trial may be available)
👉 Gamma
Recommended use: Turn your article outline into a clean slide deck for sharing and repurposing
Auto-convert trending articles into short-form videos (free trial may be available)
👉 Revid.ai
Recommended use: Generate short-video scripts and visuals from your headline/section structure
Faceless explainer video generation (free creation may be available)
👉 Nolang
Recommended use: Create narrated explainer videos from bullet points or simple diagrams
Full task automation (start from a free plan)
👉 Make.com
Recommended use: Automate your workflow from publishing → social posting → logging → next-task creation
※Links may include affiliate tracking, and free tiers/features can change; please check each official site for the latest details.